
The global economic landscape continues shifting as we approach 2026. This year holds special significance beyond typical economic cycles.
The FIFA World Cup 2026 will unfold across three major economies. Understanding these nations’ economic positions provides crucial context for investors and analysts worldwide.
This comprehensive analysis examines the world’s largest economies. We explore GDP rankings, purchasing power parity metrics, and per capita income data that define economic leadership in 2026.
The 2026 FIFA World Cup represents the first tournament hosted by three nations simultaneously. The United States, Canada, and Mexico will welcome millions of visitors, creating unprecedented economic opportunities across North America.
Economic output measurement has evolved beyond simple gross domestic product figures. Modern analysis incorporates living standards, natural resources, and foreign investment flows.
The following sections detail each economy’s strengths and challenges. We examine how hosting the World Cup impacts the economic trajectory of participating nations.
Understanding Economic Measurements and Rankings
Economists use multiple metrics to evaluate national economies. The most common measurement is gross domestic product.
GDP represents the total value of goods and services produced within a country’s borders. This fundamental metric provides a snapshot of economic activity and output.
Nominal GDP Explained
Nominal GDP measures economic output using current market prices. This approach does not adjust for inflation or price differences between countries.
The United States leads in nominal GDP calculations. This measurement reflects the actual dollar value of economic production without adjustments.
Purchasing Power Parity Methodology
Purchasing power parity offers a different perspective on economic strength. PPP adjusts for price level differences between nations.
This measurement reveals how far income goes in each country. PPP comparisons show real living standards more accurately than nominal figures alone.
The International Monetary Fund and World Bank publish PPP-adjusted data annually. These organizations provide standardized methodologies for global economic comparisons.
Nominal GDP Benefits
Nominal GDP provides straightforward comparison using current exchange rates. Investors and policymakers prefer this metric for international transactions.
- Reflects actual market values
- Uses current exchange rates
- Simplifies international comparisons
- Tracks immediate economic changes
PPP Advantages
Purchasing power parity reveals true living standards across economies. This metric accounts for local price variations and cost of living differences.
- Adjusts for price differences
- Shows real purchasing capability
- Reflects actual living standards
- Eliminates exchange rate distortions
GDP Per Capita Insights
Per capita measurements divide total GDP by population. This calculation shows average economic output per person in each nation.
- Indicates average prosperity levels
- Accounts for population size
- Compares living standards effectively
- Reveals income distribution patterns
Growth Rate Importance
Economic growth rates show momentum and trajectory. These percentages indicate whether economies expand or contract year over year.
- Measures economic momentum
- Forecasts future trends
- Guides investment decisions
- Reflects policy effectiveness
Key Economic Indicators Beyond GDP
Comprehensive economic analysis extends beyond gross domestic product. Multiple factors contribute to a nation’s economic health and global standing.
Natural resources availability affects long-term economic sustainability. Countries rich in oil, minerals, or agricultural land often enjoy competitive advantages in global markets.
| Economic Indicator | What It Measures | Why It Matters |
| Foreign Direct Investment | Cross-border capital flows into businesses and infrastructure | Indicates international confidence and future growth potential |
| Trade Balance | Difference between exports and imports | Reveals competitive position in global markets |
| Unemployment Rate | Percentage of workforce without jobs | Reflects labor market health and economic utilization |
| Inflation Rate | Price increases over time | Affects purchasing power and economic stability |
| Government Debt | Total national borrowing | Impacts fiscal flexibility and future growth capacity |
The financial sector’s sophistication influences economic rankings significantly. Countries with robust banking systems and capital markets attract more investment and facilitate faster growth.
Standard of living metrics incorporate education, healthcare, and infrastructure quality. These factors determine whether economic growth translates into improved citizen welfare.
Global Economic Landscape in 2026
The world economy continues recovering from recent disruptions. Global GDP growth stabilizes around sustainable levels as inflation pressures moderate across major economies.
Technological innovation drives productivity gains in developed nations. Artificial intelligence and automation reshape traditional industries and create new economic opportunities.
Regional Economic Trends
Asia maintains its position as the fastest-growing economic region. China and India lead regional expansion despite facing different developmental challenges.
North American economies benefit from nearshoring trends. Manufacturing returns to the United States, Canada, and Mexico as companies reduce supply chain vulnerabilities.
European economies navigate energy transition challenges. The shift toward renewable resources requires massive infrastructure investment while maintaining competitiveness.
The 2026 FIFA World Cup creates a unique economic catalyst for North America. Infrastructure spending accelerates across host cities, while tourism preparation stimulates service sector growth months before the tournament begins.
Emerging Economic Powers
Several nations outside the traditional top 10 demonstrate remarkable economic momentum. These emerging markets reshape global trade patterns and investment flows.
Vietnam and Indonesia lead Southeast Asian growth. Manufacturing expansion and young populations drive rapid economic development in these countries.
Gulf nations diversify beyond oil dependence. Saudi Arabia and the United Arab Emirates invest heavily in technology, tourism, and renewable energy sectors.
- Advanced technological infrastructure
- Sophisticated financial markets
- High per capita income levels
- Strong legal and regulatory frameworks
- Established global trade relationships
- World-class educational institutions
Developed Economy Strengths
- Rapid GDP growth rates
- Young and expanding workforces
- Lower labor costs
- Increasing consumer markets
- Government development incentives
- Untapped natural resources
Emerging Market Advantages
World Economic Forum Projections
International economic organizations forecast moderate growth for 2026. The World Bank projects global GDP expansion between 2.8% and 3.2% for the year.
Trade volumes recover as geopolitical tensions ease in certain regions. However, strategic competition between major powers continues influencing investment decisions and supply chain configurations.
Climate considerations increasingly affect economic planning. Countries balancing environmental sustainability with growth objectives face complex policy trade-offs throughout 2026.
How We Rank the Top 10 Economies in the World
Our ranking methodology combines multiple authoritative sources. We primarily use nominal GDP data from the International Monetary Fund and World Bank databases.
This approach ensures consistency with international standards. Economic output measurements reflect 2026 estimates based on current growth trajectories and policy environments.
Data Sources and Verification
Official government statistics provide foundation data for our analysis. National statistical agencies report GDP figures quarterly, which international organizations then verify and standardize.
The IMF conducts Article IV consultations with member countries. These reviews assess economic policies and validate reported economic data for accuracy.
Cross-referencing multiple sources strengthens our ranking reliability. We compare figures from the World Bank, IMF, OECD, and regional development banks before finalizing positions.
Currency exchange rate fluctuations affect nominal GDP comparisons. Our rankings use average annual exchange rates rather than spot rates to minimize volatility distortions.
Recent years have seen significant economic shifts. The COVID-19 pandemic, inflation surges, and supply chain disruptions created unprecedented volatility requiring careful analytical adjustments.
Weighting Different Economic Factors
While nominal GDP determines primary rankings, we consider supplementary factors. These additional metrics provide context for understanding each economy’s true strength and potential.
Growth momentum receives significant attention in our analysis. Countries experiencing rapid expansion may soon challenge current rankings, making trend identification crucial for forward-looking assessments.
Economic diversification affects long-term sustainability. Nations dependent on single sectors face greater volatility than those with balanced economic structures across multiple industries.
1. United States – The World’s Largest Economy
The United States maintains its position as the world’s largest economy in 2026. With nominal GDP exceeding $28 trillion, the American economy represents approximately 25% of global economic output.
This massive economic machine drives innovation across technology, finance, and healthcare sectors. The country’s dominance stems from multiple competitive advantages built over decades.

Economic Structure and Key Sectors
The service sector dominates American economic output. Finance, technology, healthcare, and professional services generate the majority of GDP and employment.
Silicon Valley continues leading global technology innovation. Major companies like Apple, Microsoft, and Google drive productivity gains through cutting-edge software and hardware development.
The financial sector in New York remains the world’s most sophisticated. Wall Street facilitates trillions in daily transactions, providing capital allocation services globally.
Technology Sector
Represents over $2 trillion in annual output. Software development, semiconductor manufacturing, and artificial intelligence research lead innovation worldwide.
- Software and cloud computing dominance
- Semiconductor design leadership
- AI and machine learning advancement
- Biotechnology breakthroughs
Financial Services
New York serves as the global financial capital. Banking, investment management, and insurance services generate massive economic value.
- Largest stock market capitalization
- Premier investment banking hub
- Advanced fintech ecosystem
- Global currency reserve status
Healthcare Industry
Healthcare spending exceeds $4 trillion annually. Medical research, pharmaceutical development, and healthcare delivery create millions of high-paying jobs.
- Leading medical research facilities
- Pharmaceutical innovation centers
- Advanced medical device manufacturing
- Biotechnology development
GDP Per Capita and Living Standards
American GDP per capita exceeds $85,000 in 2026. This figure places the United States among the highest-income large economies globally.
However, income distribution remains uneven across regions and demographics. Coastal urban areas generally enjoy higher per capita incomes than rural interior regions.
The standard of living benefits from abundant consumer choices. Americans access diverse goods and services at competitive prices due to market size and competition.
Natural Resources and Energy Independence
The United States ranks among the world’s top energy producers. Shale oil and natural gas extraction transformed America into a net energy exporter during recent years.
Agricultural productivity remains exceptional. American farms produce massive quantities of corn, soybeans, wheat, and livestock, feeding domestic markets while exporting globally.
Renewable energy capacity expands rapidly. Solar and wind installations grow exponentially as costs decline and policy support strengthens across multiple states.
“The American economy’s strength lies not just in its size, but in its adaptability and innovation capacity. The ability to reinvent industries and create new markets remains unmatched globally.”
2026 World Cup Economic Impact on the United States
The United States hosts the majority of 2026 FIFA World Cup matches. Eleven American cities prepare stadiums and infrastructure for millions of international visitors.
Tourism spending will surge during the tournament month. Hotels, restaurants, and transportation services across host cities anticipate record revenues from soccer fans worldwide.
Infrastructure improvements extend beyond stadiums. Cities upgrade public transportation, expand airport capacity, and renovate urban spaces to accommodate increased visitor volumes.
Economic analysts project the World Cup will generate between $5-7 billion in direct economic activity for the United States. Indirect effects through employment, tax revenues, and long-term tourism promotion could double this impact over subsequent years.
Job creation accelerates in hospitality and construction sectors. Temporary positions supporting the tournament provide income for thousands of workers in host metropolitan areas.
Global media attention showcases American cities to billions of viewers. This exposure promotes future tourism and business investment in host regions long after the final match concludes.
| Host City | Stadium Capacity | Expected Visitors | Infrastructure Investment |
| New York/New Jersey | 82,500 | 450,000 | $350 million |
| Los Angeles | 70,000 | 380,000 | $280 million |
| Dallas | 80,000 | 320,000 | $240 million |
| Miami | 65,000 | 290,000 | $220 million |
| San Francisco Bay Area | 68,500 | 310,000 | $260 million |
Economic Challenges and Opportunities
The United States faces persistent fiscal deficits. Federal debt exceeds 100% of GDP, raising concerns about long-term sustainability and interest payment burdens.
Infrastructure maintenance requires significant investment. Roads, bridges, and public transportation systems need modernization to maintain economic competitiveness.
Labor market tightness creates wage pressure. Companies struggle to find qualified workers in technology and skilled trades, potentially constraining growth.
Climate transition presents both costs and opportunities. Shifting toward renewable energy requires massive capital investment while creating new industries and employment sectors.
2. China – Economic Powerhouse of Asia
China holds the second position among the world’s largest economies. With nominal GDP approaching $19 trillion, the Chinese economy represents roughly 18% of global output.
The country’s rapid development over four decades transformed it into a manufacturing superpower. China’s economic model combines state planning with market mechanisms in unique ways.

Manufacturing and Export Leadership
China remains the world’s factory floor. The country produces everything from electronics to textiles, serving both domestic and international markets.
Export volumes continue growing despite trade tensions. Chinese manufacturers adapt to changing global demand patterns while moving up the value chain toward higher-quality products.
The Belt and Road Initiative expands China’s economic influence. Massive infrastructure investments across Asia, Africa, and Europe create new trade corridors and market access.
Technological Advancement and Innovation
Chinese technology companies challenge Western dominance in multiple sectors. Firms like Huawei, Alibaba, and Tencent compete globally in telecommunications, e-commerce, and digital services.
Artificial intelligence research accelerates rapidly. China invests heavily in AI development, aiming for technological leadership in this critical future industry.
Electric vehicle production leads globally. Chinese manufacturers produce more EVs than any other country, supported by government incentives and charging infrastructure development.
Economic Strengths
- Massive manufacturing capacity and efficiency
- Large domestic consumer market exceeding 1.4 billion people
- Significant foreign exchange reserves
- Advanced infrastructure in major urban centers
- Strong government investment capacity
- Rapid technology sector growth
Economic Challenges
- Aging population reducing workforce growth
- High corporate and local government debt levels
- Real estate sector vulnerabilities
- Environmental sustainability pressures
- Trade tensions with Western economies
- Middle-income trap risks
GDP Per Capita and Income Distribution
Chinese GDP per capita reaches approximately $13,500 in 2026. While lower than developed Western economies, this represents massive progress from just decades ago.
Income inequality persists between urban and rural areas. Coastal cities enjoy prosperity levels approaching developed nations, while interior regions lag significantly behind.
The government pursues “common prosperity” policies. These initiatives aim to reduce wealth gaps through taxation, regulation, and targeted development programs.
Purchasing Power Parity Perspective
When measured by purchasing power parity, China’s economy appears even larger. PPP-adjusted GDP exceeds that of the United States, reflecting lower domestic price levels.
This measurement shows the real goods and services Chinese income can purchase. Living costs in China remain substantially lower than in Western developed economies for many categories.
The gap between nominal and PPP GDP highlights development stage differences. As China continues developing, this gap should narrow through currency appreciation and price convergence.
3. Germany – Europe’s Economic Engine
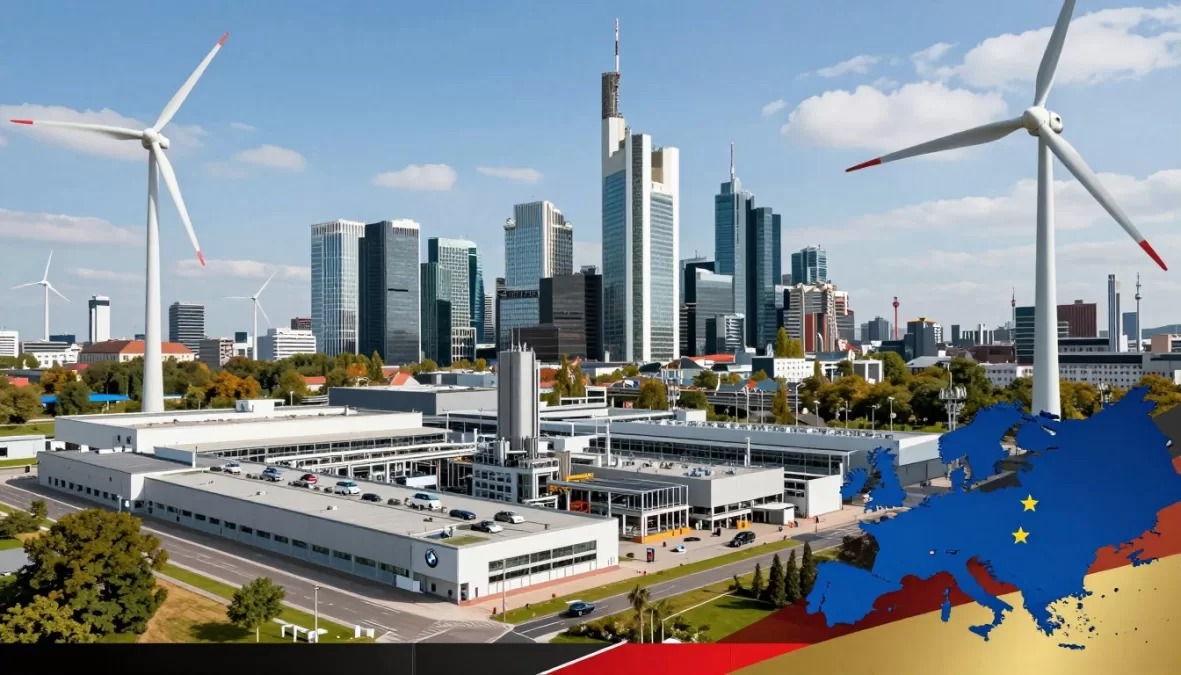
Germany ranks as Europe’s largest economy and third globally. With nominal GDP near $4.5 trillion, Germany drives European economic performance and policy.
The country’s export-oriented model focuses on high-quality manufacturing. German engineering excellence and industrial productivity create competitive advantages in global markets.
Industrial Powerhouse and Exports
German manufacturing represents the economy’s core strength. Automobiles, machinery, chemicals, and precision instruments dominate export portfolios.
The automotive sector faces transformation challenges. Traditional internal combustion expertise must transition toward electric vehicles and autonomous driving technologies.
Machinery and industrial equipment exports remain robust. German capital goods equip factories worldwide, reflecting superior engineering and reliability reputations.
Economic Output and Per Capita Income
Germany’s GDP per capita exceeds $54,000 in 2026. This places the country among the world’s highest-income economies with excellent living standards.
The social market economy balances capitalism with welfare provisions. Strong labor protections and social safety nets coexist with competitive business environments.
Regional economic disparities persist decades after reunification. Eastern German states still lag western regions in productivity and income levels despite significant investment.
Germany’s Mittelstand companies—small and medium enterprises—form the backbone of economic success. These family-owned businesses specialize in niche manufacturing sectors, achieving global leadership in specific product categories while maintaining strong local employment.
Energy Transition and Sustainability
Germany pursues ambitious renewable energy goals. The Energiewende policy aims for carbon neutrality while phasing out nuclear power generation.
Energy costs pose competitiveness challenges. Industrial electricity prices in Germany exceed those in competing economies, affecting manufacturing profitability.
Natural gas dependency creates vulnerabilities. Reduced Russian gas supplies force diversification toward liquefied natural gas imports and accelerated renewable development.
Download Complete 2026 World Cup Economic Impact Report
Get exclusive access to our comprehensive 50-page analysis covering all aspects of how the FIFA World Cup 2026 will transform North American economies. This detailed report includes investment opportunities, tourism projections, infrastructure developments, and sector-by-sector impact assessments for the United States, Canada, and Mexico.
4. Japan – Advanced Technology Leader
Japan maintains its position as the fourth-largest economy globally. With nominal GDP around $4.2 trillion, Japan combines technological sophistication with manufacturing excellence.
The country pioneered many modern manufacturing techniques. Japanese companies set global standards in automotive production, electronics, and robotics.

Technological Innovation and Robotics
Japan leads global robotics development and deployment. Industrial robots manufactured in Japan automate factories worldwide, improving productivity and precision.
Consumer electronics innovation continues despite increased competition. Japanese brands maintain premium positions in cameras, audio equipment, and gaming consoles.
Semiconductor equipment manufacturing represents a crucial strength. Japanese companies produce essential machinery for global chip production.
Demographic Challenges and Solutions
Japan faces the world’s most aged population. Over 28% of citizens exceed 65 years old, creating workforce and social welfare challenges.
Population decline accelerates annually. Deaths exceed births by hundreds of thousands each year, shrinking the domestic market and tax base.
Automation partially addresses labor shortages. Japanese companies invest heavily in robotics and AI to compensate for worker scarcity.
Economic Advantages
- World-class technological capabilities
- Strong manufacturing expertise and quality reputation
- Highly educated workforce
- Excellent infrastructure throughout the country
- Low crime rates and social stability
- Advanced healthcare system
Economic Challenges
- Rapidly aging population demographics
- High government debt exceeding 250% of GDP
- Deflationary pressures persisting for decades
- Limited natural resources requiring imports
- Rigid labor market reducing flexibility
- Slow adoption of digital services
GDP Per Capita and Living Standards
Japanese GDP per capita approaches $34,000 in 2026. While lower than some Western peers, this figure reflects high purchasing power due to moderate domestic prices.
The standard of living remains excellent across most metrics. Japan offers universal healthcare, low crime, efficient public transportation, and high-quality education.
Income equality exceeds that of many developed economies. Japan’s Gini coefficient indicates relatively modest wealth gaps compared to the United States or United Kingdom.
Monetary Policy and Economic Stimulus
The Bank of Japan maintains ultra-loose monetary policy. Interest rates remain near zero as policymakers combat deflationary tendencies and stimulate growth.
Quantitative easing programs continue at massive scale. The central bank owns substantial portions of government bonds and equity market investments.
Currency intervention prevents excessive yen appreciation. A stronger yen would damage export competitiveness, Japan’s economic lifeline.
5. India – Rising Economic Giant
India claims the fifth spot among the world’s largest economies. With nominal GDP exceeding $3.9 trillion, India represents the fastest-growing major economy globally.
The country’s young population provides demographic advantages. Over 65% of Indians are under 35 years old, creating a massive workforce and consumer market.

Rapid Growth and Development
India’s economy grows at approximately 6-7% annually. This expansion rate exceeds developed economies and most other large emerging markets.
The services sector drives economic growth. Information technology, business process outsourcing, and financial services generate significant export revenues and employment.
Manufacturing expansion accelerates under government initiatives. “Make in India” policies attract foreign investment in electronics, automobiles, and consumer goods production.
Information Technology and Services
Indian IT companies serve clients globally. Firms like Infosys, Wipro, and TCS provide software development and consulting services to Fortune 500 companies worldwide.
The country produces massive numbers of engineering graduates annually. This talent pool supports both domestic startups and multinational subsidiaries operating in India.
Digital services adoption grows rapidly. Mobile payments, e-commerce, and online education platforms reach hundreds of millions of previously unbanked citizens.
Per Capita Income and Poverty Reduction
India’s GDP per capita remains modest at approximately $2,800. However, this figure rises steadily as economic growth outpaces population expansion.
Poverty rates decline significantly over recent decades. Hundreds of millions of Indians enter the middle class, though substantial poverty persists in rural areas.
Income inequality increases alongside overall growth. Urban professionals enjoy prosperity while rural agricultural workers see slower income gains.
| Economic Indicator | 2020 | 2023 | 2026 (Projected) | Growth Rate |
| Nominal GDP (Trillions USD) | $2.7 | $3.5 | $3.9 | +44% |
| GDP Per Capita (USD) | $1,950 | $2,500 | $2,800 | +44% |
| Foreign Investment (Billions USD) | $64 | $71 | $85 | +33% |
| Exports (Billions USD) | $276 | $451 | $520 | +88% |
| Manufacturing Share (%) | 15.3% | 16.8% | 18.2% | +19% |
Infrastructure Development Needs
India requires massive infrastructure investment to sustain growth. Roads, railways, ports, and power generation capacity need expansion and modernization.
The government launches ambitious infrastructure programs. High-speed rail projects, smart cities initiatives, and renewable energy installations receive substantial funding allocations.
Foreign investment increasingly targets infrastructure sectors. International firms partner with Indian companies on transportation, energy, and telecommunications projects.
6. United Kingdom – Global Financial Center
The United Kingdom maintains the sixth-largest economy globally. With nominal GDP around $3.5 trillion, the UK economy centers on services, particularly financial services.
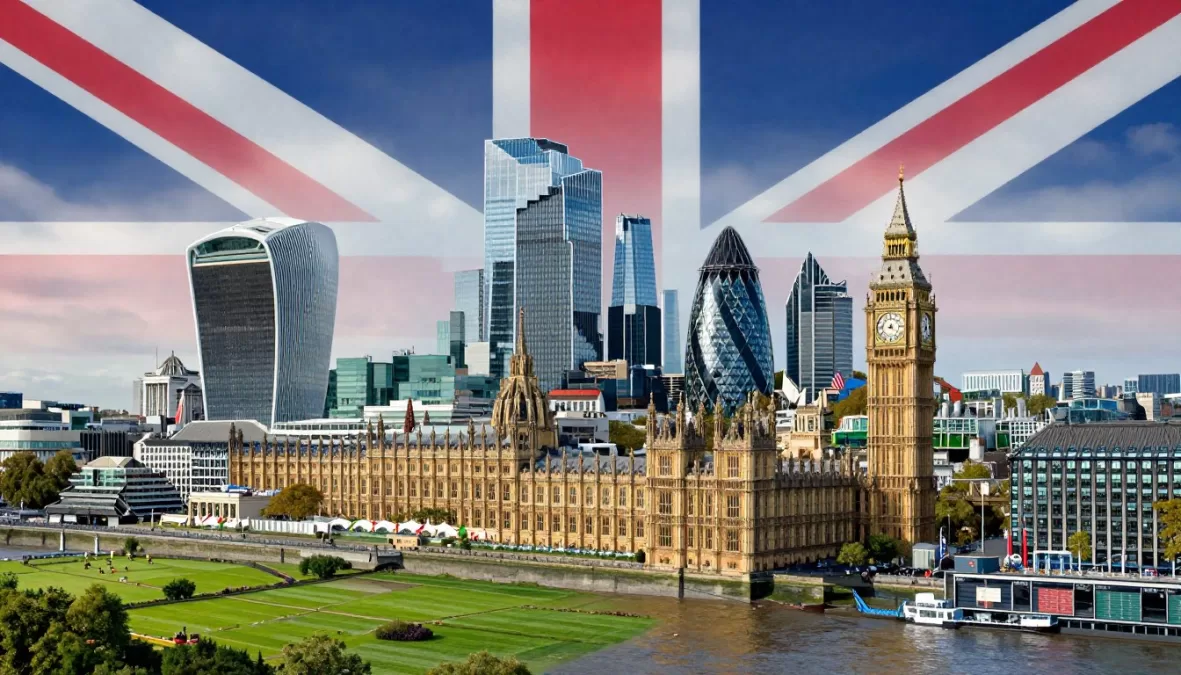
London serves as one of the world’s premier financial centers. The city competes with New York for dominance in banking, investment management, and insurance services.
Financial Services Dominance
The financial sector generates approximately 7% of British GDP. Banking, insurance, and asset management firms headquartered in London serve global clients.
Foreign exchange trading concentrates heavily in London. The city handles over 40% of global currency transactions daily, exceeding all other financial centers.
Fintech innovation flourishes in the UK. Digital banking, payment processing, and blockchain startups thrive in London’s supportive regulatory environment.
Post-Brexit Economic Adjustments
Brexit continues reshaping UK economic relationships. New trade agreements replace European Union membership, creating both opportunities and frictions.
Trade volumes with the EU remain substantial despite new barriers. Businesses adapt to customs procedures and regulatory divergence affecting cross-border commerce.
The country pursues independent trade policy globally. Agreements with non-European nations aim to compensate for reduced EU market access advantages.
GDP Per Capita and Living Standards
British GDP per capita reaches approximately $48,000 in 2026. This positions the UK as a high-income economy with generally excellent living standards.
Regional economic disparities persist across the country. London and Southeast England significantly outperform Northern regions in productivity and income levels.
The National Health Service provides universal healthcare. This public system ensures medical access regardless of income, though quality concerns arise periodically.
7. France – Diversified European Power
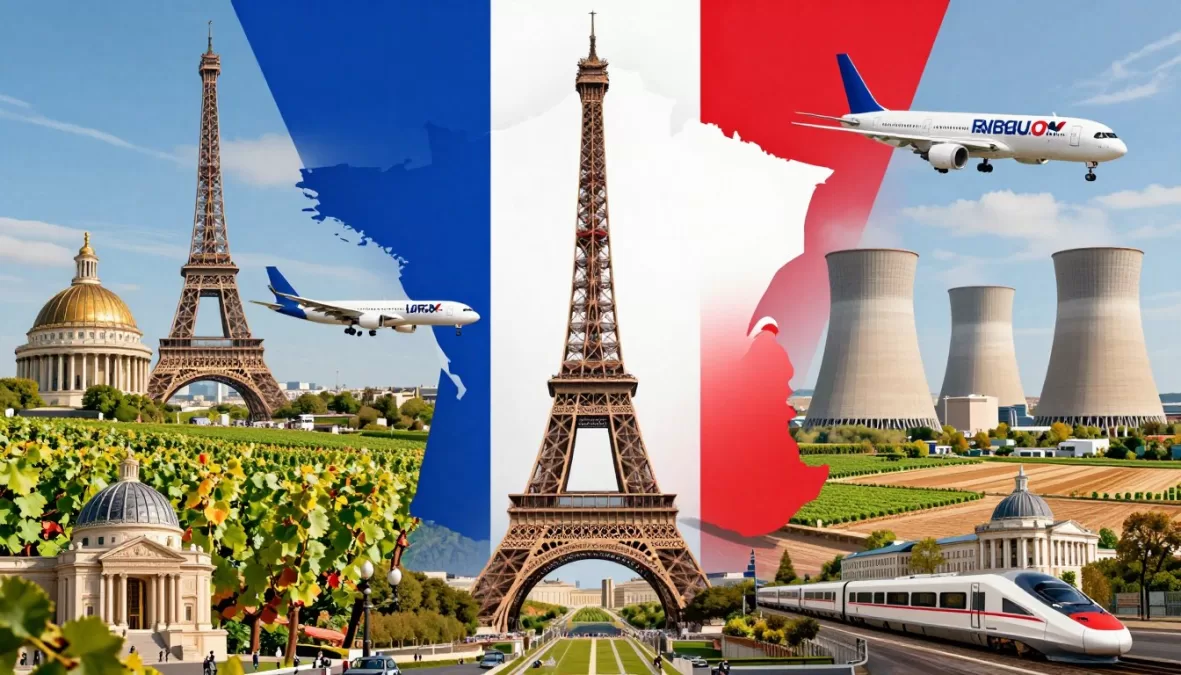
France ranks seventh among the world’s largest economies. With nominal GDP near $3.1 trillion, France combines industrial strength with agricultural productivity and luxury goods excellence.
The country enjoys diverse economic foundations. Manufacturing, agriculture, tourism, and services all contribute significantly to economic output.
Luxury Goods and Fashion Leadership
French luxury brands dominate global markets. Companies like LVMH, Hermès, and Chanel set standards in fashion, cosmetics, and accessories worldwide.
The wine and spirits industry generates substantial export revenues. French wines, champagne, and cognac command premium prices in international markets.
Tourism represents a major economic sector. France attracts more international visitors than any other country, supporting millions of hospitality and service jobs.
Industrial and Aerospace Strength
Aerospace manufacturing constitutes a crucial industrial sector. Airbus, headquartered partially in France, competes globally with Boeing for commercial aircraft orders.
Nuclear energy provides approximately 70% of electricity generation. This energy independence supports industrial competitiveness through stable power costs.
Automotive production continues despite global competition. Renault and Peugeot-Citroën maintain significant domestic manufacturing presence while expanding internationally.
Economic Challenges and Reforms
High public spending characterizes the French economic model. Government expenditures exceed 55% of GDP, the highest among major developed economies.
Labor market rigidity creates employment challenges. Strict worker protections discourage hiring, contributing to persistent unemployment rates above European averages.
Pension system reforms generate political controversy. An aging population requires adjustments to retirement ages and benefit calculations, facing strong resistance.
8. Canada – Resource-Rich World Cup Host
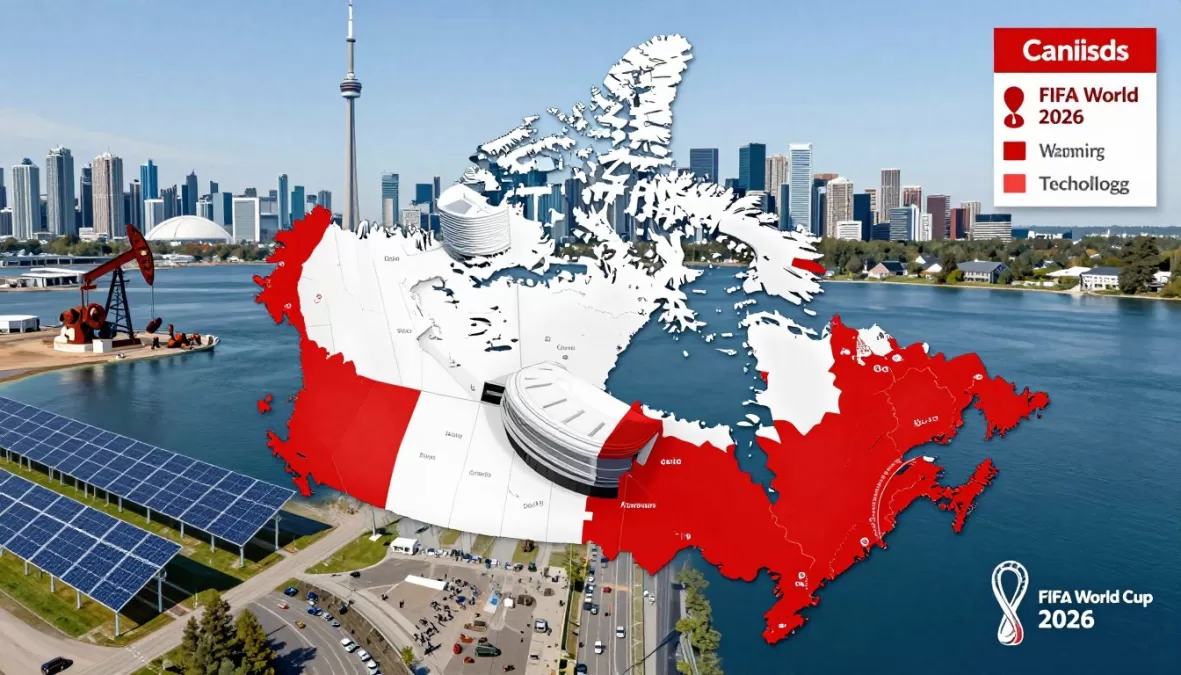
Canada holds the eighth position among the world’s largest economies. With nominal GDP approaching $2.2 trillion, Canada combines natural resource wealth with advanced services and manufacturing sectors.
The country’s proximity to the United States creates significant trade advantages. Over 75% of Canadian exports flow to American markets, integrating the economies closely.
Natural Resources and Energy Exports
Canada ranks among the world’s largest oil producers. Alberta’s oil sands contain massive reserves, though extraction costs exceed conventional petroleum production.
Natural gas exports expand through new liquefaction facilities. LNG terminals on the Pacific coast enable sales to Asian markets, diversifying beyond traditional American buyers.
Mineral resources remain abundant and economically significant. Canada produces substantial quantities of gold, copper, nickel, potash, and uranium for global markets.
Banking System and Financial Stability
Canadian banks rank among the world’s most stable. Conservative lending practices and strong regulation helped Canada avoid the worst effects of past financial crises.
The financial sector contributes approximately 7% of GDP. Toronto serves as the country’s financial capital, hosting headquarters of major banks and investment firms.
Real estate markets drive economic activity in major cities. Housing prices in Toronto and Vancouver reach extraordinary levels, creating affordability challenges.
GDP Per Capita and Quality of Life
Canadian GDP per capita exceeds $52,000 in 2026. This places Canada among high-income economies with excellent overall living standards.
Universal healthcare provides comprehensive medical coverage. The publicly funded system ensures access regardless of income, though wait times for some procedures can be lengthy.
Immigration drives population and economic growth. Canada welcomes hundreds of thousands of immigrants annually, supporting workforce expansion and consumer demand.
Canada’s multicultural population creates unique advantages for global business. Immigrants maintain connections to home countries, facilitating international trade relationships and investment flows that benefit the Canadian economy.
2026 World Cup Impact on Canada
Canada co-hosts the 2026 FIFA World Cup alongside the United States and Mexico. Two Canadian cities prepare stadiums and infrastructure for tournament matches.
Toronto and Vancouver invest heavily in facility upgrades. Stadium renovations, transportation improvements, and hospitality capacity expansions prepare these cities for international visitors.
Tourism promotion opportunities extend beyond the tournament itself. Global media coverage showcases Canadian cities to billions of viewers, potentially attracting future visitors and business investment.
Toronto World Cup Preparations

BMO Field undergoes significant expansion to accommodate World Cup matches. Capacity increases to 45,000 seats with enhanced amenities for international spectators.
- Stadium capacity expansion project
- Public transit route enhancements
- Hotel room availability increases
- Tourism infrastructure improvements
Vancouver Host City Development

BC Place receives technology and facility upgrades to international standards. Vancouver positions itself as the premier Pacific Northwest tournament destination.
- Advanced stadium technology installation
- Waterfront fan experience zones
- International airport capacity expansion
- Sustainable event management planning
National Economic Benefits
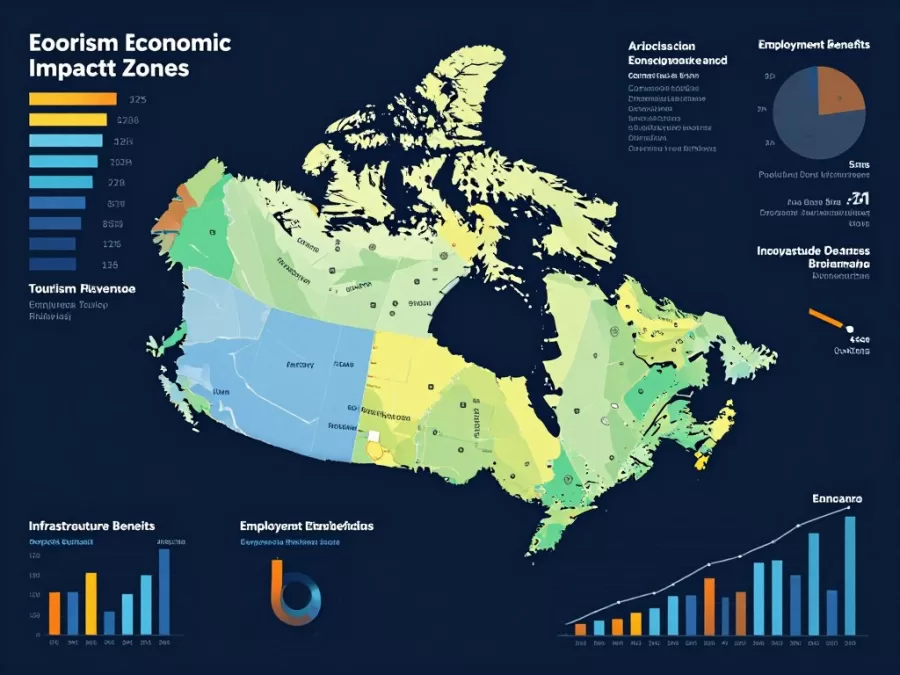
Economists project $1.2-1.8 billion in direct economic impact for Canada. Indirect effects through employment and long-term tourism could double this benefit.
- Estimated 15,000 temporary jobs created
- $300-450 million in tourism spending
- Long-term destination marketing value
- Infrastructure legacy improvements
The tournament strengthens Canada’s international sports profile. Success hosting World Cup matches positions the country for future major sporting event opportunities.
Cross-border economic cooperation with the United States and Mexico intensifies. Joint hosting requires coordination on security, transportation, and visitor services across three nations.
9. Italy – Manufacturing and Cultural Heritage
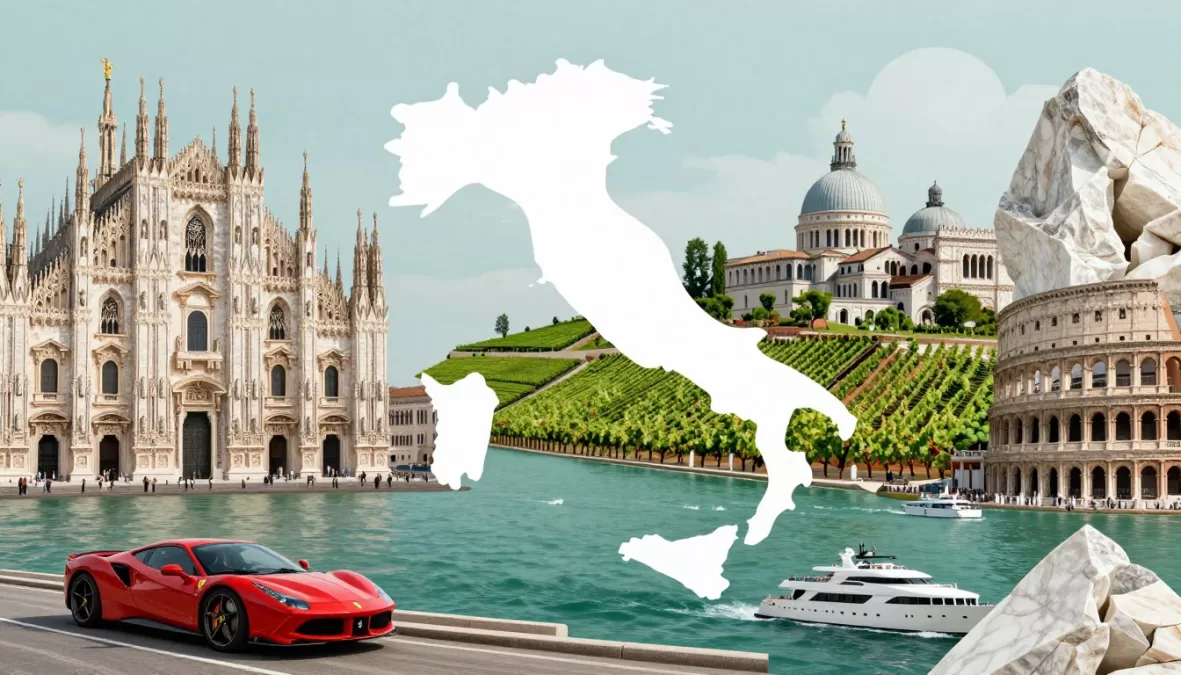
Italy maintains the ninth-largest economy globally. With nominal GDP around $2.2 trillion, Italy combines industrial manufacturing strength with cultural tourism and luxury goods production.
The country’s economy faces structural challenges despite significant assets. Regional disparities, high public debt, and productivity stagnation create headwinds for growth.
Manufacturing Excellence and Industrial Districts
Italian manufacturing specializes in high-quality niche products. Industrial districts concentrate expertise in specific sectors like textiles, machinery, and furniture.
The automotive sector maintains global prestige through luxury brands. Ferrari, Lamborghini, and Maserati represent Italian engineering excellence despite modest production volumes.
Fashion and luxury goods generate substantial export revenues. Italian brands like Prada, Gucci, and Armani compete globally in clothing, accessories, and footwear markets.
Tourism Industry Significance
Italy attracts over 60 million international visitors annually. Rome, Venice, Florence, and Milan draw tourists seeking art, history, and cultural experiences.
Tourism contributes approximately 13% of GDP. Hotels, restaurants, museums, and transportation services employ millions across the country.
Cultural heritage sites require ongoing preservation investment. Italy contains more UNESCO World Heritage Sites than any other nation, creating maintenance responsibilities.
Economic Challenges and Debt Burden
Public debt exceeds 140% of GDP in Italy. This burden limits government fiscal flexibility and raises concerns about long-term sustainability.
Productivity growth lags other developed economies. Italian worker output per hour has stagnated for two decades, undermining competitiveness.
The banking sector struggles with non-performing loans. While improving, bad debt levels still exceed European averages, constraining lending capacity.
10. Brazil – South American Economic Leader
Brazil claims the tenth position among the world’s largest economies. With nominal GDP approaching $2.1 trillion, Brazil dominates South American economic activity.
The country possesses enormous natural resource wealth. Agriculture, mining, and energy sectors provide competitive advantages in global commodity markets.
Agricultural Powerhouse Status
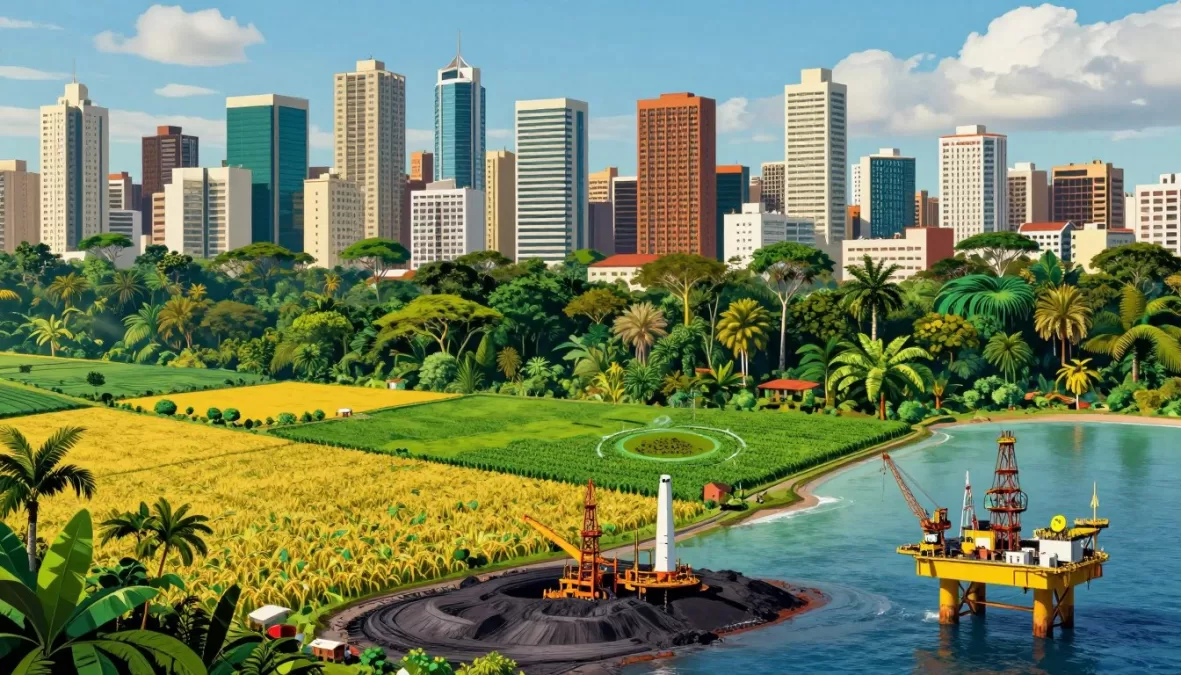
Brazil ranks among the world’s largest agricultural exporters. The country produces massive quantities of soybeans, coffee, sugar, beef, and poultry for global markets.
Agricultural technology adoption drives productivity gains. Brazilian farmers utilize advanced machinery, biotechnology, and data analytics to maximize yields.
Deforestation concerns create international pressure. Balancing agricultural expansion with Amazon rainforest preservation generates ongoing environmental debates.
Natural Resources and Energy
Brazil produces significant petroleum volumes from offshore fields. Pre-salt oil discoveries transformed the country into a major crude exporter during recent years.
Iron ore mining supports global steel production. Brazilian mines supply Chinese and other international steel mills with essential raw materials.
Renewable energy capacity continues expanding rapidly. Hydroelectric power generates most electricity, supplemented by growing wind and solar installations.
Economic Volatility and Challenges
Brazil experiences significant economic volatility. Growth rates fluctuate dramatically between years, creating planning difficulties for businesses and households.
Income inequality remains among the world’s highest. A small wealthy elite contrasts sharply with widespread poverty in urban favelas and rural areas.
Political instability affects economic policy consistency. Frequent government changes and corruption scandals undermine business confidence and foreign investment.
Currency volatility creates additional economic uncertainty. The Brazilian real fluctuates significantly against the dollar, affecting import costs and export competitiveness.
Infrastructure deficiencies constrain growth potential. Roads, ports, and railways require modernization to support efficient commodity exports and manufacturing distribution.
Explore 2026 World Cup Investment Opportunities
The 2026 FIFA World Cup creates unprecedented business and investment opportunities across North America. Our specialized resource center provides detailed analysis of sectors poised for growth, including hospitality, infrastructure, real estate, and tourism services in all host cities.
Investment Guide
Comprehensive analysis of investment opportunities in host cities including real estate, hospitality, and infrastructure sectors.
Market Trends Newsletter
Weekly insights on World Cup-related economic developments, tourism projections, and business opportunities.
Expert Webinar Series
Join our quarterly webinars featuring economists and industry experts analyzing World Cup economic impacts.
Economies Just Outside the Top 10
Several significant economies rank just below the top 10 list. These nations demonstrate substantial economic power and influence regional dynamics.
Understanding these economies provides fuller context for global economic relationships. Many of these countries experience rapid growth that may soon elevate their rankings.
Russia – Energy Superpower
Russia would rank within the top 10 based on purchasing power parity measurements. The country’s economy centers on oil and natural gas exports to European and Asian markets.
Economic sanctions affect growth and development. Western restrictions limit access to technology and financial markets, constraining economic potential.
Natural resources provide resilience despite challenges. Energy exports generate foreign currency regardless of geopolitical tensions.
South Korea – Technology and Manufacturing
South Korea represents a highly developed economy with world-class technology companies. Samsung and LG compete globally in electronics and home appliances.
Shipbuilding and automotive sectors remain competitive internationally. Korean companies produce vessels and vehicles sold worldwide.
The country achieves high GDP per capita levels exceeding many European nations. Living standards reflect successful economic development over recent decades.
Australia – Resource-Rich Developed Economy
Australia combines developed economy characteristics with massive mineral wealth. Iron ore, coal, and natural gas exports flow primarily to Asian markets.
The financial and professional services sectors drive urban economic activity. Sydney and Melbourne host regional headquarters for multinational corporations.
High per capita income reflects both resource wealth and service sector productivity. Australians enjoy excellent living standards by global measures.
Spain – Tourism and Diversified Economy
Spain ranks as Europe’s fourth-largest economy. Tourism represents a crucial sector, with beaches and cultural attractions drawing tens of millions of visitors annually.
Manufacturing maintains significance despite competition. Automotive production and renewable energy equipment manufacturing support industrial employment.
Economic recovery from past crises continues gradually. Unemployment rates decline from crisis peaks but remain above European averages.
Mexico – Manufacturing and World Cup Co-Host
Mexico stands as Latin America’s second-largest economy. Manufacturing exports to the United States drive economic growth through USMCA trade agreement benefits.
The automotive industry represents Mexico’s manufacturing crown jewel. American, European, and Asian car manufacturers operate extensive production facilities throughout the country.
Nearshoring trends accelerate manufacturing investment. Companies relocate production from Asia to Mexico, seeking proximity to American markets and reduced supply chain risks.
Mexico’s 2026 World Cup Economic Opportunity
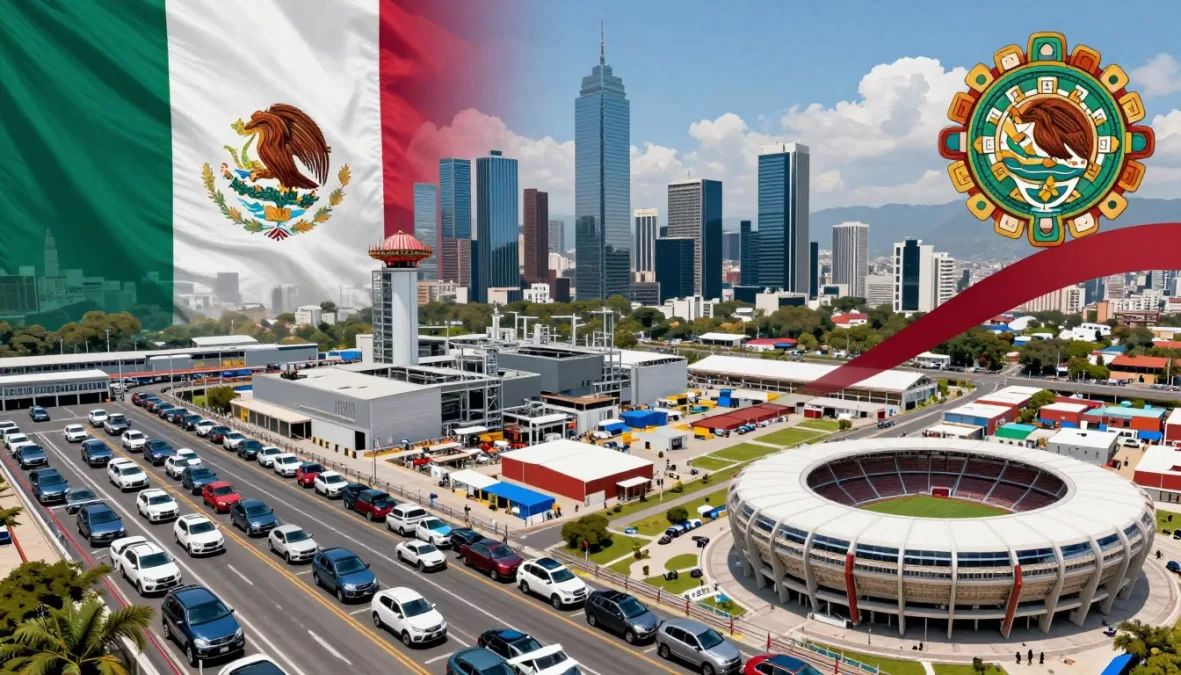
Mexico co-hosts the 2026 FIFA World Cup alongside the United States and Canada. Three Mexican cities prepare venues for tournament matches, creating economic opportunities.
Tourism infrastructure receives significant investment before the tournament. Hotels, restaurants, and transportation services expand capacity to accommodate international visitors.
The World Cup provides global marketing value for Mexican destinations. Billions of viewers worldwide see Mexican cities during match broadcasts, promoting future tourism.
| Mexican Host City | Stadium | Capacity | Infrastructure Investment | Expected Visitors |
| Mexico City | Estadio Azteca | 87,000 | $220 million | 380,000 |
| Guadalajara | Estadio Akron | 48,000 | $165 million | 240,000 |
| Monterrey | Estadio BBVA | 53,500 | $185 million | 270,000 |
Economic impact studies project substantial benefits for Mexico. Direct spending during the tournament plus long-term tourism increases could generate $1.5-2.0 billion in economic value.
Job creation extends across multiple sectors. Construction, hospitality, security, and transportation industries all add positions supporting World Cup operations.
Saudi Arabia – Oil Wealth and Diversification
Saudi Arabia possesses the world’s second-largest proven oil reserves. Petroleum exports generate massive revenue funding government operations and development projects.
Economic diversification efforts accelerate under Vision 2030 plans. The government invests in tourism, entertainment, technology, and renewable energy to reduce oil dependence.
Mega-projects like NEOM demonstrate ambitious development goals. These initiatives aim to create entire new cities focused on technology and sustainable living.
Indonesia – Southeast Asian Giant
Indonesia represents Southeast Asia’s largest economy. With over 270 million people, the country offers a massive domestic consumer market.
Commodity exports drive foreign exchange earnings. Palm oil, coal, and natural gas shipments flow to regional and global buyers.
Manufacturing expands as labor costs in China rise. Textile, electronics, and automotive component production increasingly locates in Indonesian factories.
Get Your Complete 2026 World Cup Economic & Travel Guide
Planning to attend the 2026 FIFA World Cup or invest in host city opportunities? Our comprehensive guide covers everything you need to know about the economic landscape, tourism opportunities, and practical information for all 16 North American host cities.
Comparing Economic Metrics Across Top Economies
Direct comparisons reveal strengths and weaknesses across the world’s largest economies. Different measurement approaches highlight varying aspects of economic performance.
Nominal GDP rankings differ from purchasing power parity measurements. These variations reflect price level differences and currency valuation factors.
Nominal GDP versus PPP Rankings
China surpasses the United States when measured by purchasing power parity. This reflects lower domestic prices in China compared to America.
India ranks third globally using PPP measurements. The country’s large population and lower price levels elevate its position significantly.
Germany and Japan maintain similar positions under both methodologies. Developed economy price levels create less divergence between nominal and PPP figures.
| Country | Nominal GDP Rank | Nominal GDP (Trillions) | PPP Rank | PPP GDP (Trillions) |
| United States | 1 | $28.0 | 2 | $28.0 |
| China | 2 | $19.0 | 1 | $33.0 |
| Germany | 3 | $4.5 | 5 | $5.3 |
| Japan | 4 | $4.2 | 4 | $6.5 |
| India | 5 | $3.9 | 3 | $14.6 |
| United Kingdom | 6 | $3.5 | 9 | $3.9 |
| France | 7 | $3.1 | 10 | $3.7 |
| Canada | 8 | $2.2 | 15 | $2.3 |
| Italy | 9 | $2.2 | 12 | $3.2 |
| Brazil | 10 | $2.1 | 8 | $4.0 |
Per Capita Income Comparisons
GDP per capita reveals average prosperity levels across economies. This metric divides total economic output by population.
Small wealthy nations often lead per capita rankings. Countries like Luxembourg and Switzerland exceed all large economies in per capita income.
Among top 10 economies, the United States leads in per capita GDP. Canada and Germany follow closely behind America in this measurement.
High GDP Per Capita Economies
- United States: $85,000
- Canada: $52,000
- Germany: $54,000
- United Kingdom: $48,000
- France: $46,000
- Japan: $34,000
Emerging Economy Per Capita
- China: $13,500
- Brazil: $10,100
- Mexico: $10,700
- India: $2,800
- Indonesia: $5,200
- South Africa: $7,500
Economic Growth Rate Analysis
Growth rates indicate economic momentum and future trajectory. Emerging markets typically grow faster than developed economies.
India leads major economies in growth rate projections. Annual expansion around 6-7% significantly exceeds developed nation performance.
China’s growth moderates as the economy matures. Rates decline from double-digit historical levels toward more sustainable 4-5% annual expansion.
Developed economies grow more slowly but steadily. The United States, Germany, and other advanced nations expand at 1.5-2.5% annually in normal conditions.
Future Economic Projections and Trends
Global economic rankings will shift during coming decades. Demographic trends, technological change, and policy decisions reshape relative positions among nations.
Emerging markets gain share of global GDP gradually. China and India particularly increase their portions of world economic output.
Demographic Impacts on Economic Rankings
Population growth drives economic expansion in developing nations. Young, growing populations provide workforce expansion supporting GDP increases.
Aging populations constrain developed economy growth. Japan and European nations face workforce declines requiring productivity gains to maintain output levels.
Africa’s population boom creates long-term potential. The continent’s workforce will expand dramatically through mid-century, offering growth opportunities if properly developed.
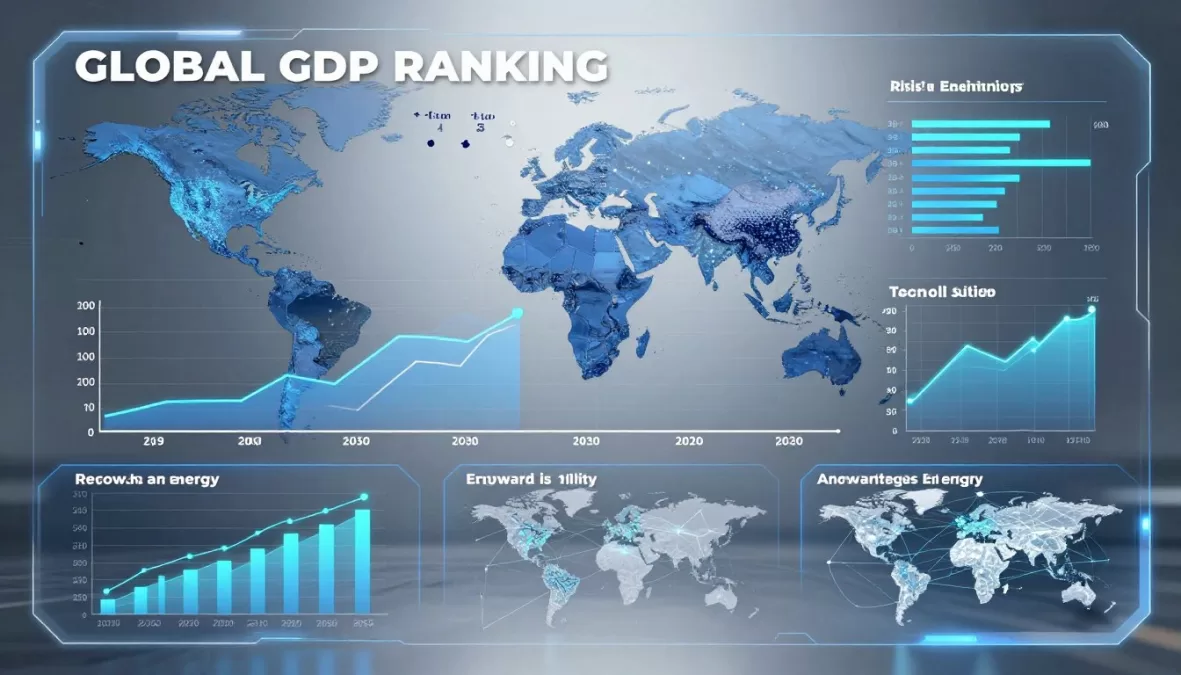
Technology and Productivity Trends
Artificial intelligence adoption accelerates across industries. Countries leading in AI development and deployment gain competitive advantages in productivity and innovation.
Automation reshapes manufacturing and services sectors. Robots and software increasingly perform routine tasks, requiring workforce adaptation and training.
Digital infrastructure becomes crucial for economic competitiveness. Nations investing in broadband networks, data centers, and computing capacity position themselves advantageously.
Climate Change Economic Impacts
Energy transition requires massive infrastructure investment globally. Countries shifting toward renewable energy face near-term costs but long-term benefits.
Climate adaptation costs increase for vulnerable regions. Coastal cities and agricultural zones need protection from rising seas and changing weather patterns.
Green technology leadership creates economic opportunities. Nations developing renewable energy equipment, electric vehicles, and efficiency technologies capture growing global markets.
The 2026 FIFA World Cup demonstrates how major sporting events increasingly incorporate sustainability goals. Host countries invest in renewable energy, public transportation, and green building standards, creating templates for future economic development aligned with environmental objectives.
Geopolitical Shifts and Trade Patterns
Regional trade blocs reshape global commerce patterns. USMCA, EU, RCEP, and other agreements create preferential trading zones affecting economic relationships.
Supply chain restructuring continues following recent disruptions. Companies diversify production locations, reducing concentration in single countries or regions.
Strategic competition influences investment flows. Technology transfer restrictions and security concerns affect where companies invest and with whom they partner.
Investment Implications of Economic Rankings
Understanding global economic rankings guides investment decisions. Portfolio allocation across countries requires analysis of growth potential, risks, and opportunities.
Large economies offer stability and developed financial markets. Investing in top economies provides liquidity and regulatory protection for capital.
Developed Market Investment Characteristics
United States equity markets provide diverse investment opportunities. Thousands of publicly traded companies span all sectors and size categories.
European markets offer value in established industries. Financial services, luxury goods, and industrial companies trade at reasonable valuations.
Japanese stocks benefit from corporate governance improvements. Increasing shareholder focus drives better returns than past decades delivered.
- Strong legal and regulatory frameworks
- Deep, liquid capital markets
- Transparent financial reporting
- Political stability and property rights
- Advanced corporate governance
- Lower currency volatility
- Reliable infrastructure
Developed Market Advantages
- Slower GDP growth rates
- Higher labor costs
- Aging populations
- High valuations in many sectors
- Regulatory compliance costs
- Limited expansion opportunities
- Lower return potential
Developed Market Challenges
Emerging Market Opportunities and Risks
Emerging markets offer higher growth potential with increased volatility. Countries like India and Indonesia provide equity returns exceeding developed markets during favorable periods.
Currency risk affects emerging market investments significantly. Exchange rate fluctuations can enhance or eliminate returns for foreign investors.
Political and regulatory risks remain elevated in developing economies. Policy changes, corruption, and institutional weaknesses create uncertainties absent in developed markets.
Sector-Specific Opportunities
Technology investments concentrate in the United States and China. These nations dominate software, semiconductors, and internet services globally.
Renewable energy opportunities span multiple geographies. Germany, China, and the United States all offer investment options in solar, wind, and battery technologies.
Consumer goods companies benefit from emerging market growth. Multinational corporations selling to expanding middle classes in Asia and Latin America offer participation in global growth trends.
Technology Sector Focus
United States and Chinese markets dominate global technology investment opportunities. Software, semiconductors, and AI companies lead innovation.
- American software and cloud leaders
- Chinese e-commerce giants
- Global semiconductor manufacturers
- AI and machine learning startups
Renewable Energy
Energy transition creates opportunities across developed and emerging markets. Solar, wind, and battery storage companies benefit from global climate policies.
- Solar panel manufacturers
- Wind turbine producers
- Battery technology companies
- Grid infrastructure providers
Consumer Markets
Emerging market consumer spending drives opportunities in retail, food, and luxury goods. Rising incomes expand markets for established brands.
- Luxury goods brands
- Food and beverage companies
- Retail and e-commerce platforms
- Automotive manufacturers
World Cup-Related Investment Themes
The 2026 FIFA World Cup creates specific investment opportunities in North America. Host city real estate, hospitality companies, and infrastructure contractors benefit from tournament preparations.
Tourism-related investments gain from increased visitor flows. Hotels, airlines, and entertainment venues in host cities see demand surges during and after the tournament.
Sponsor companies receive global marketing exposure. Official World Cup partners gain brand recognition among billions of viewers worldwide.
Economic Policy Frameworks Across Top Economies
Different countries employ varying economic policy approaches. These frameworks reflect historical experiences, political systems, and development stages.
Understanding policy differences helps explain economic performance variations. Government roles in markets differ substantially across the top 10 economies.
Free Market versus State-Directed Models
The United States emphasizes market-driven allocation. Government intervention remains relatively limited compared to other developed economies.
China employs significant state direction of economic activity. State-owned enterprises control key sectors while market mechanisms govern others.
European economies generally balance market forces with social protections. Strong welfare states coexist with competitive private sectors.
Fiscal Policy Approaches
Government spending and taxation vary dramatically across economies. These choices affect growth rates, inequality, and public services quality.
The United States maintains lower tax burdens than European peers. This approach limits government services while leaving more income with households and businesses.
France and other European nations tax more heavily. Higher revenues fund comprehensive healthcare, education, and social safety nets.
Emerging economies often struggle with tax collection. Informal sectors and administrative capacity limitations constrain government revenues.
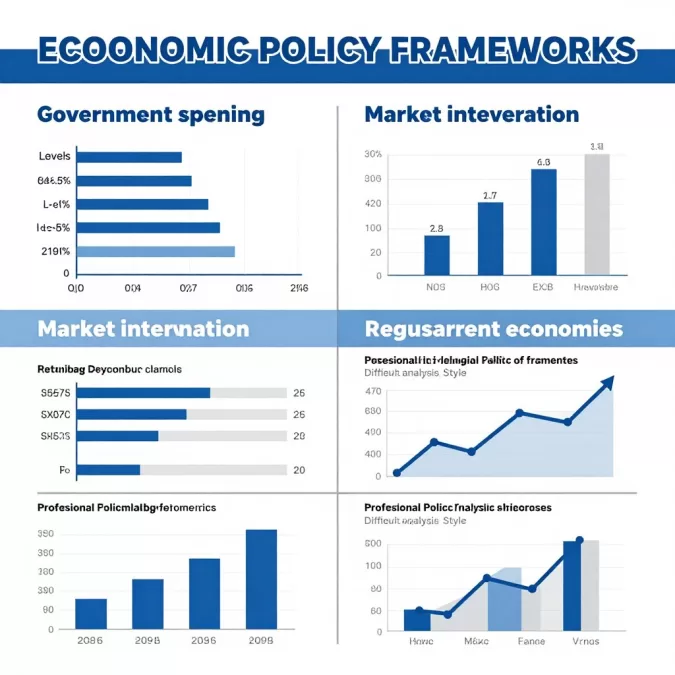
Monetary Policy and Central Banking
Independent central banks manage monetary policy in most developed economies. Interest rate decisions aim to balance inflation control with growth support.
The Federal Reserve influences global financial conditions significantly. American monetary policy affects exchange rates and capital flows worldwide.
European Central Bank coordinates policy across eurozone nations. This centralized approach creates challenges for countries with divergent economic conditions.
Trade Policy and Globalization Approaches
Countries pursue different trade strategies reflecting their competitive positions. Export-oriented economies favor open markets while protecting strategic sectors.
China maintains significant trade barriers despite WTO membership. Foreign investment restrictions and state subsidies protect domestic industries.
The United States negotiates bilateral and regional trade agreements. These deals aim to open foreign markets while protecting American workers and companies.
European Union creates a massive single market internally. External trade policy balances openness with protection for agriculture and sensitive industries.
Conclusion: The Dynamic Global Economic Landscape of 2026
The world’s top 10 economies continue shaping global commerce and development. These economic powerhouses drive innovation, trade, and investment flows affecting all nations.
Economic rankings shift gradually over time. Emerging markets gain ground while developed economies adapt to new competitive realities.
The 2026 FIFA World Cup highlights economic interconnections across North America. United States, Canada, and Mexico demonstrate how major events catalyze economic activity and cooperation.
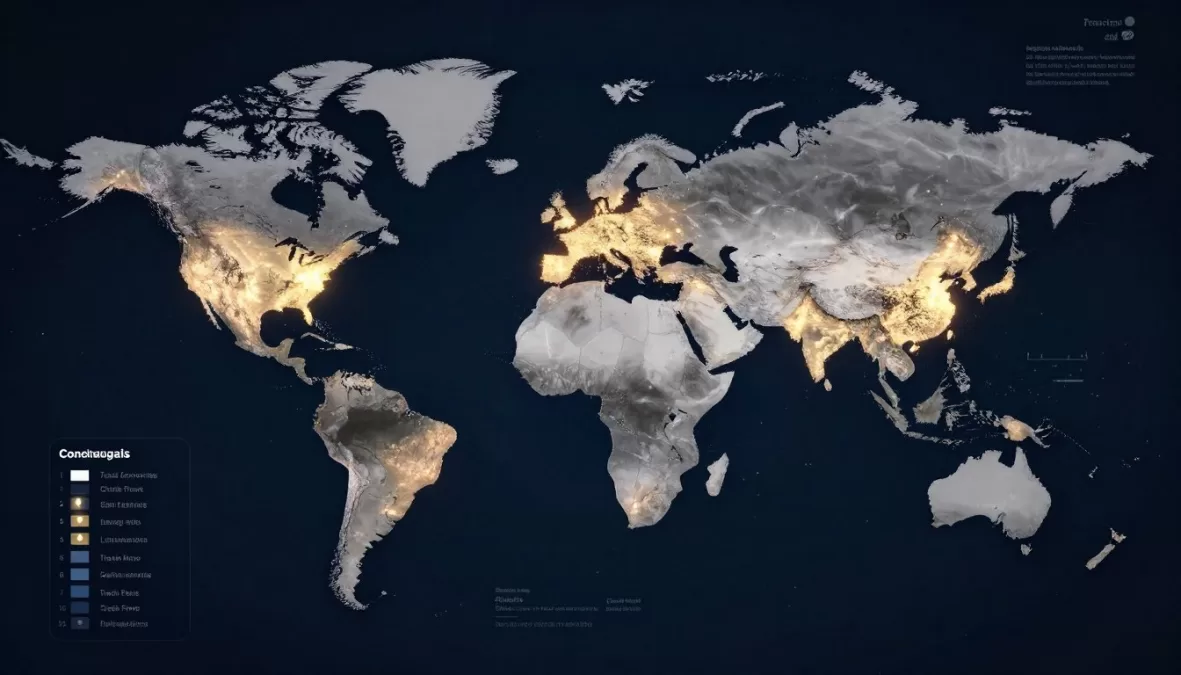
Understanding these economies provides context for investment decisions. Whether allocating capital or planning business expansion, global economic knowledge proves essential.
Technological change accelerates across all major economies. Countries embracing innovation and productivity improvements position themselves advantageously for future growth.
Climate transition reshapes economic strategies worldwide. Nations balancing environmental sustainability with development needs will lead coming decades.
The global economy in 2026 stands at a crossroads between traditional growth models and sustainable development paths. How the world’s largest economies navigate energy transition, technological disruption, and demographic shifts will determine prosperity for billions of people in coming decades.
Demographic trends create divergent challenges and opportunities. Young, growing populations in India and Africa contrast sharply with aging societies in Japan and Europe.
Geopolitical competition influences economic relationships increasingly. Strategic considerations affect trade, investment, and technology transfer decisions among major powers.
The top 10 economies in the world collectively represent over 65% of global GDP. Their policies, growth trajectories, and interactions fundamentally shape international economic conditions.
Regional economic integration continues advancing through trade agreements. USMCA strengthens North American cooperation while other blocs deepen ties in Asia and Europe.
Natural resources remain crucial for economic development. Countries rich in energy, minerals, and agricultural land enjoy competitive advantages in global markets.
Financial sector sophistication separates developed from developing economies. Advanced capital markets facilitate investment and risk management more effectively than nascent systems.
Education and human capital development increasingly determine economic success. Nations investing in workforce skills and innovation capacity build foundations for sustained prosperity.
Stay Informed About Global Economic Trends
The global economic landscape evolves continuously. Keep up with the latest developments, investment opportunities, and analysis of the world’s top economies through our comprehensive resources.
Join thousands of investors, business professionals, and economics enthusiasts who rely on our analysis for informed decision-making. Free subscription includes weekly market updates, quarterly deep-dive reports, and exclusive access to expert webinars.
Frequently Asked Questions About Top World Economies
What is the difference between nominal GDP and purchasing power parity?
Nominal GDP measures economic output using current market exchange rates. This approach shows the actual dollar value of goods and services produced.
Purchasing power parity adjusts for price differences between countries. PPP reveals how much people can actually buy with their income in different nations.
China’s economy appears larger than America’s when measured by PPP. However, the United States leads in nominal GDP rankings.
How does hosting the 2026 World Cup benefit the economies of the United States, Canada, and Mexico?
The 2026 FIFA World Cup creates multiple economic benefits for host countries. Direct spending by visitors on hotels, restaurants, and transportation generates immediate revenue.
Infrastructure improvements extend beyond the tournament itself. Stadium renovations, transportation upgrades, and hospitality expansions create lasting economic value.
Global marketing exposure promotes long-term tourism. Billions of viewers see host cities during broadcasts, encouraging future visits and business investment.
Job creation spans construction, hospitality, security, and service sectors. Thousands of temporary positions support tournament operations.
Which economy will grow fastest among the top 10 in 2026?
India leads growth projections among the top 10 economies. Annual expansion around 6-7% significantly exceeds developed nation performance.
Young demographics drive Indian growth potential. Over 65% of the population is under 35, providing workforce expansion.
China’s growth moderates as the economy matures. Rates decline from historical double-digit levels toward 4-5% annual expansion.
Developed economies like the United States and Germany grow more slowly. Typical rates range from 1.5-2.5% annually in normal conditions.
What factors determine a country’s economic ranking?
Gross domestic product serves as the primary ranking criterion. This measures total value of goods and services produced within a country’s borders.
Population size affects total GDP significantly. Large countries like China and India benefit from huge domestic markets and workforces.
Productivity levels determine per capita income. Efficient economies generate more output per worker, improving living standards.
Natural resources provide competitive advantages. Countries rich in oil, minerals, or agricultural land often enjoy stronger economic positions.
How do economic rankings affect investment opportunities?
Large economies offer diverse investment options. Developed financial markets in top economies provide liquidity and regulatory protection.
Growth rates influence return potential significantly. Faster-growing emerging markets often deliver higher equity returns despite increased volatility.
Currency stability affects international investment decisions. Developed economy currencies fluctuate less than emerging market exchange rates.
Sector concentration varies across economies. Technology investments concentrate in the United States and China, while manufacturing opportunities span multiple countries.
Will China surpass the United States as the world’s largest economy?
China already exceeds America when measured by purchasing power parity. This reflects lower domestic prices in China compared to the United States.
Nominal GDP rankings still favor the United States significantly. The gap narrows gradually but remains substantial in 2026.
China’s growth rate slowdown affects future projections. Demographic aging and productivity challenges may prevent surpassing American nominal GDP.
Economic policies and geopolitical factors influence trajectories. Trade tensions, technology restrictions, and domestic reforms all affect relative growth rates.
What role do natural resources play in economic rankings?
Natural resources provide significant competitive advantages. Countries rich in oil, gas, minerals, or agricultural land generate export revenues and support industries.
The United States benefits from energy independence. Shale oil and gas production transformed America into a net energy exporter.
Canada leverages diverse resource wealth. Oil, natural gas, minerals, and agricultural products drive export earnings.
Resource dependence creates vulnerabilities. Economies relying heavily on commodity exports face volatility from price fluctuations.
How does GDP per capita differ from total GDP?
Total GDP measures entire economic output. This figure reflects a country’s overall economic size and global influence.
GDP per capita divides total output by population. This calculation shows average prosperity levels and living standards.
Small wealthy nations often lead per capita rankings. Countries like Luxembourg and Switzerland exceed large economies in average income.
Among top 10 economies, the United States leads in per capita GDP. Canada and Germany follow closely behind America in this measurement.

Priyanka Pandey
Senior Research Editor · Top10Sense
Priyanka specializes in tech, consumer products, and digital trends. She combines hands-on testing, vendor interviews, and database research to create trustworthy “Top 10” rankings. Her work has been referenced by industry blogs and brand report pages.